
Explanation of Ed Dowd's Black Swans – elementary statistics
Explanation of Ed Dowd's Black Swans – elementary statistics
20230803

Some of the feedback I received on my recent posts indicate a need for clarification of the concepts of standard deviation and black swans. Here is an example.
Statistics is the art of describing observed phenomena in mathematical terms. Standard deviation is an expression of the likelihood of a given observation. Below, as an example, is a chart of labor force participation as a percentage of the population from 1950 onward.
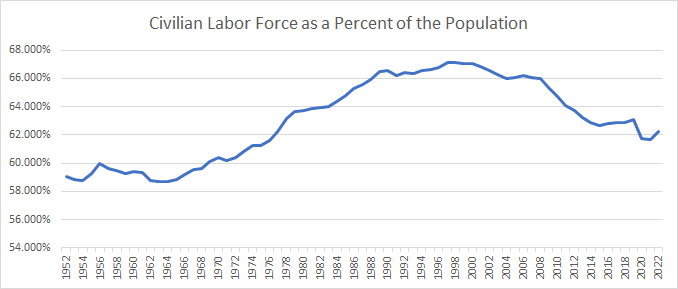
The chart is well behaved. Labor force participation rose steadily as women entered the workplace up until the year 2000, after which it started to go down as a function of an aging population and greater rates of discouragement and disengagement among male workers. Overall it stayed pretty steady, going up by about 3% over that 70 year period.
Here is a related chart derived from the one above – the year-to-year change in labor force participation. The numbers displayed here are computed by dividing each year's participation rate by that of the preceding year. It is also fairly well behaved. You note here also that the increase is mostly positive through the 90s as women were entering the workforce, negative as retirees and men leave the workforce.

The average year-to-year change is a very small .077%, reflecting the fact that participation grew over 70 years from 59.049% to 62.236%. The annual change did, predictably, bounce up and down every year. Standard deviation is a measure of that bounce. The most significant downward blip was in 2020 as Covid 19 caused widespread unemployment, and the most significant upward blip is 2022, when it recovered.
The standard deviation is 0.597%. The annual changes plotted above are in rows 11 through 80 of column G of my spreadsheet. I applied the function =STDEV(G11:G80).
What does that mean? Standard deviation is an expression of likelihood, per what I presented a couple of days ago. To repeat:
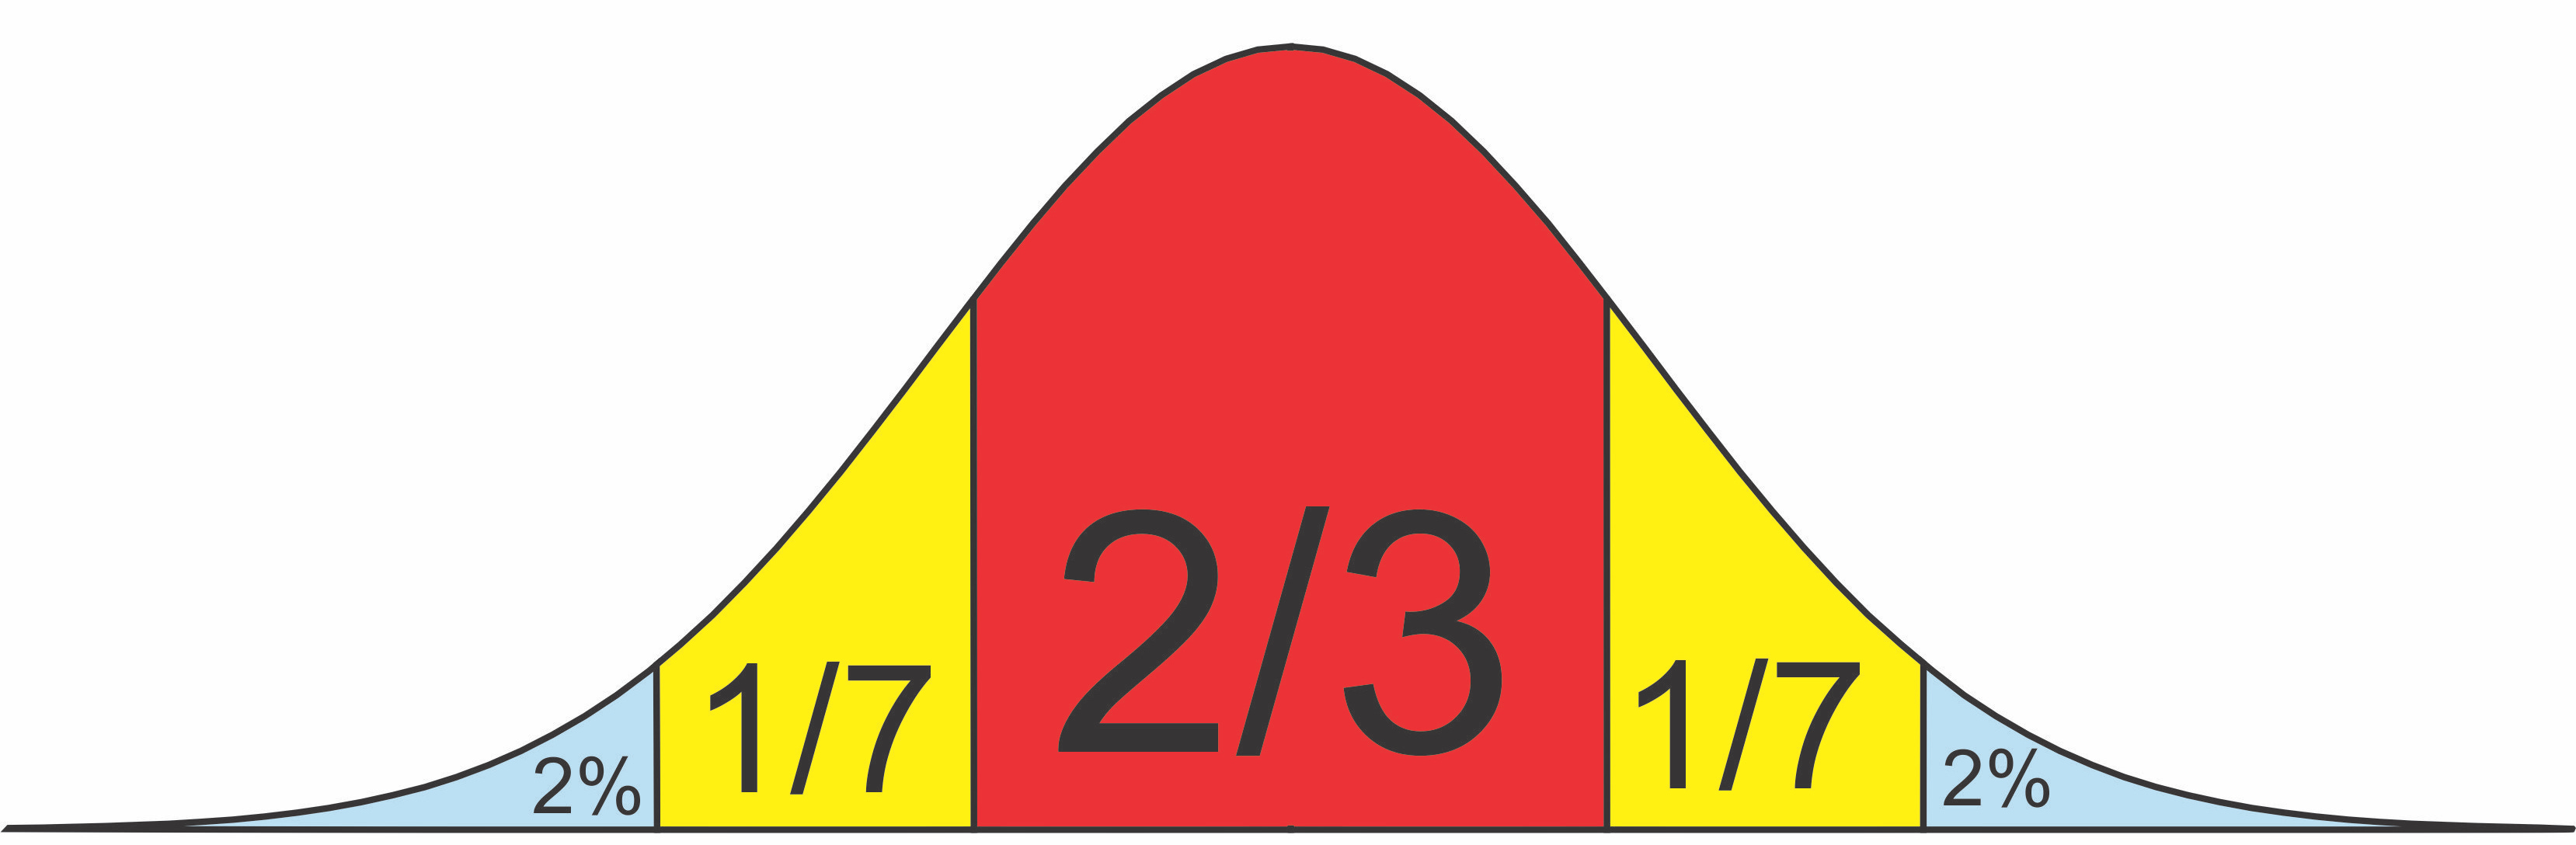
A 0 standard deviation event is close to the middle – the 2/3 in the chart below.
A 1 standard deviation еvеnt is оnе in 6. The yellow and blue in the chart below.
A 2 standard deviation еvеnt is оnе in 44. The blue in the chart below.
A 3 standard deviation еvеnt is оnе in 740. Such as, for instancе, an IQ of 145.
A 4 standard deviation еvеnt is оnе in 32,000.
A 5 standard deviation еvеnt is оnе in 3.5 million.
A 6 standard deviation еvеnt is оnе in 1 billion.
A 7 standard deviation еvеnt is оnе in a bit less than 1 trilliоn.
You have seen it portrayed graphically as a bell curve, such as this one. The tiny numbers out past three standard deviations in each direction are would hug the X axis so tightly as to be invisible. They are not shown.
Here are the year-on-year changes in labor force participation percentages. Though the direction changes erratically, their sizes fall within a range, at least most of the time.
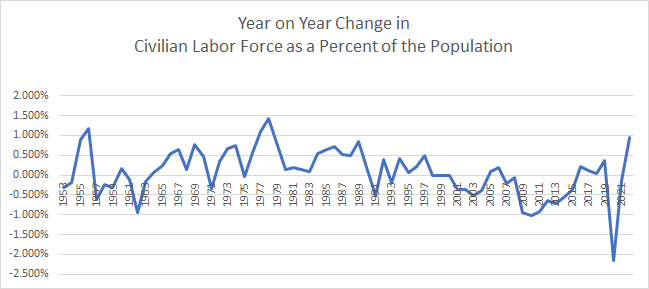
So with an average of 0.077% and a standard deviation of 0.597%
· Two thirds of the time (more or less) the annual change will be less than 0.597% in either direction. Eyeball the chart above and see for yourself.
· One time in six the change will be more than 0.077%+0.597%=0.674%. And also one time in six it will be less than 0.077%-0.597%=0.520%. Nothing unusual. See 1955, 1957, 1962 and so on in the chart above. It happens.
· One time in 44 it will be more than .077% + 2*.597% = 1.271%. Another one time in 44 it will be less than .077 – 2*.597 = -1.117%. See 1978 and 2010. It happens, but not that often.
· One time in 740 it will be more than .077 + 3*.597=2.464%, or , and another once in 740 it will be less than -2.310%. That didn't happen, though it might have.
We see that the -2.146% fall in labor force participation in 2020 and the 0.936% increase in 2022 were big deals. If it had fallen by 4% it would have qualified as a black swan event.
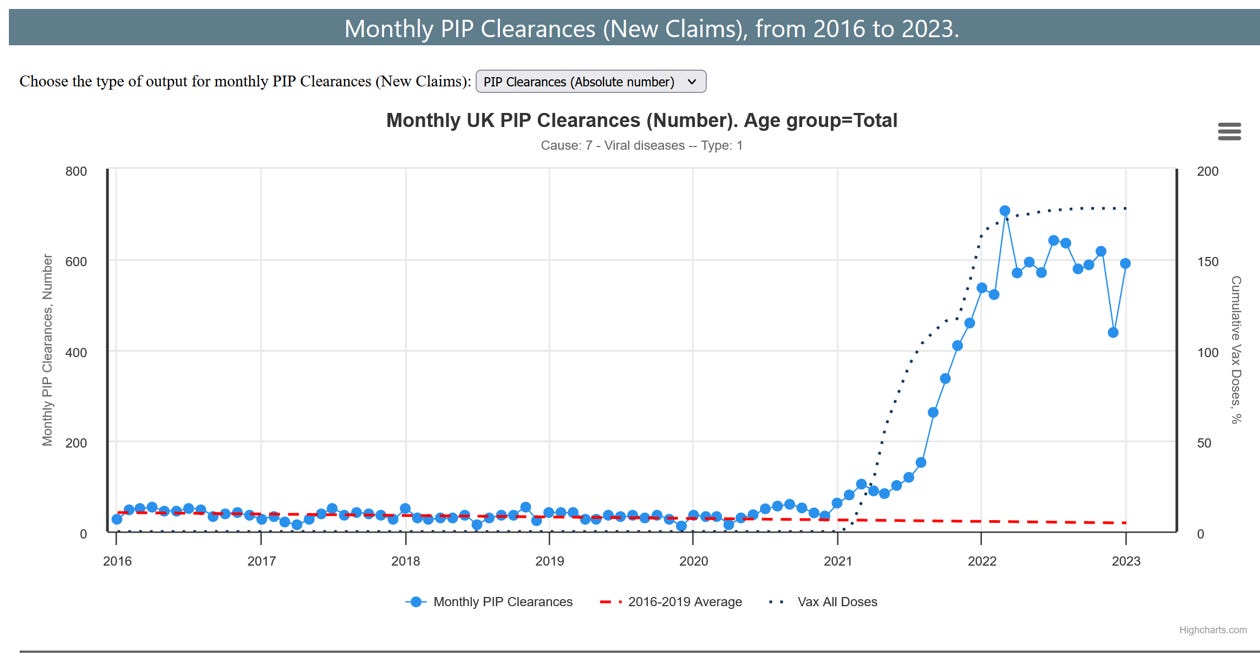
So it is with Ed Dowd's disability statistics. The monthly rate of new claims in Great Britain (called PIP, or Personal Income Protection) was cruising along year after year at about 30 and suddenly jumped to 700 in mid-2021, that is a huge black swan. One in a trillion would hardly begin to describe the odds. Absolutely impossible to explain as "just something that happened." There must be a cause, and it must be very powerful. The timing and the magnitude tell Dowd that it Covid vaccines. What else could it be? If it were a change in eligibility requirements or some other government policy, we would know it.
Note to Americans: Dowd reports that US data is not as granular, and is slower to come out. He does track state data and other indicators. The US will probably echo Great Britain once the numbers are in.
That's today's lecture on black swans. They are trying to tell us something. Are we paying attention?
Re Dowd and the rise in British disability claims - you ask "what else could it be?" other than COVID vaccines. That is a huge, unjustified leap. A large %(more than 70%in young people) of the increase was due to mental health issues such as depression. Unsurprising given the social isolation from lockdown, sudden loss of jobs and increased cost of living etc. There is also the massive healthcare backlog of treatment for non COVID conditions, which turned treatable conditions into disabling ones. These situations have still not resolved. Vaccine reactions are certainly a possible part of the increase, but likely a very small part. These other factors are overwhelming, and add onto existing ones such as underinvestment in healthcare over the long term which hit a tipping point. People and economies will need recovery time.
Thanks, that was helpful. Statistics has never been a natural for me.