

A review of "Climate of the Past, Present and Future - A Scientific Debate"
20231031

I had not reviewed any climate change books for more than a year, and nothing on paleoclimate for five years. This book is a great find. I’m not the first to find it. As difficult as it is, it has been translated into several languages, gone into a second printing, and has a large number of Amazon reviews prior to this one.
This is, however, the only review I see that attempts to summarize the book. Given that it is 740 dense pages long, I expect that many will be content with this Cliff Notes treatment.
Truth and wisdom about the climate – a long, complex book finds justifiably wide acceptance
Claiming that carbon dioxide causes global warming is like saying racism caused the civil war. It is wrong, irrelevant, and at least three orders of magnitude too simple of an explanation for a very complex situation.
This 740-page book is a tour de force from a surprising source. Javier Vinos spent decades researching neurobiology and cancer, earning more than 1200 citations for his work in this field. The climate change dispute caught his attention in 2015. He thought there was something fishy about the supposed consensus and decided to find out for himself. He has made himself an expert, especially in paleoclimatology. This book reflects a deep commitment to the scientific method combined with the fresh vision of someone coming into the field from the outside.
Another way to put it, he is a highly talented everyman, tired of being lied to by the establishment and determined to find and spread the truth. Which he does, in an erudite, low-key fashion that contrasts sharply with the harsh rhetoric of the global warming crowd.
The book is not an easy read. Paleoclimate is not an easy topic. It has its own extensive lexicon, primarily abbreviations, commonly used by scientists, such as LIA for Little Ice Age, MGW for modern global warming, SLR for sea level rise. The reader would be well advised to print his page of abbreviations for quick and frequent reference. In addition, there is an extensive glossary and 50 dense pages of bibliography. This is an authoritative work. Recognizing that many readers are not prepared for such a heavy slog, this review attempts to summarize the main points.
There have been a vast number of books written about climate change. Despite all the propaganda coming from the government and the media, most books have been skeptical. The book which best parallels Vinos’, shorter and easier to read, is Paleoclimate (Princeton Primers in Climate Book 10).
Twain wrote that “A lie can travel halfway around the world before the truth can get its boots on.” With Vinos, the boots are firmly on. He is not the first – see a list of related books at the end of this review. He joins other skeptical voices, such as those in the CO2 Coalition and Climate Depot. Maybe as many as 97% of real climate scientists agree that global warming fear is bunkum.
Science is a matter of collecting evidence to support theories, and the kinds of evidence collected to make deductions about past climate are varied and fascinating. Several of the many graphs in Vinos’ work refer to “Global temperature reconstruction from 73 proxies.” Isotopes of common elements play a role. The isotopes of an element behave identically in chemical reactions but differ in their origin, weight, and half-life. Carbon-14 we know about. Beryllium 10, with a half-life of 139,000 years, is created by and serves as a proxy for cosmic radiation. The percentages of heavy hydrogen (deuterium) and oxygen 18 provide a clue about movements of water and other molecules. Search on “usgs paleoclimate proxies” for a thorough list and explanation.
Different life forms flourish at different temperatures. Fossilized shells, pollen and other traces of their existence provide clues about past climate. Past warming can be inferred from ice shelves breaking up into icebergs that, when they melted, dropped detritus to the ocean floor. Oxygen and CO2 can be measured in fossil air from ice cores drilled in Greenland and Antarctica. Benthic (deep ocean) sedimentary rock cores show the record of plankton another life in ancient oceans. Tree rings and record seasonal climates as much as 10,000 years back.
Many natural phenomena occur in cycles. The most obvious are the seasons and the movement of the moon. Others include sunspots, tides and ice ages. This book mentions 30 or 40 cycles, each with a different effect on climate and each with a different periodicity. Teasing out their individual effects, and predicting how they compound one another, is a complex operation. Every chapter book concerns itself with cycles, evidence of cycles, and theories to explain them.
Chapter 2, The Glacial Cycle, starts with a description of three major cycles affecting the Earth’s climate. The first is eccentricity - the varying extent to which the earth’s elliptical orbit around the sun departs from being purely circular. The farther from the sun, the less sunlight we get. The second is obliquity, the tilt of the earth’s axis. It varies from 22.1 to 24.3 degrees from the plane of rotation around the sun over a 41,000-year cycle. The more the tilt, the more sun in the higher latitudes. The third is precession, the wobble of the direction in which the earth’s axis of rotation is pointed. It now points at Polaris, the north star. At the dawn of agriculture, it pointed at Vega in the constellation of Lyra.
Around 1920 Serbian Milutin Milenkovic adopted and improved the notion, originally proposed by Scotsman James Croll about 1860, that these solar cycles have an effect on climate. Much of Vinos’ book addresses the apparent inconsistencies between the strength of causes and effects. For instance, precession, the movement of the Earth’s axis, has a far bigger effect on insolation – the amount of radiation received from the sun – than the eccentricity of the Earth’s orbit around the sun. However, observations supporting the Milankovitch Theory are better correlated with eccentricity than precession.
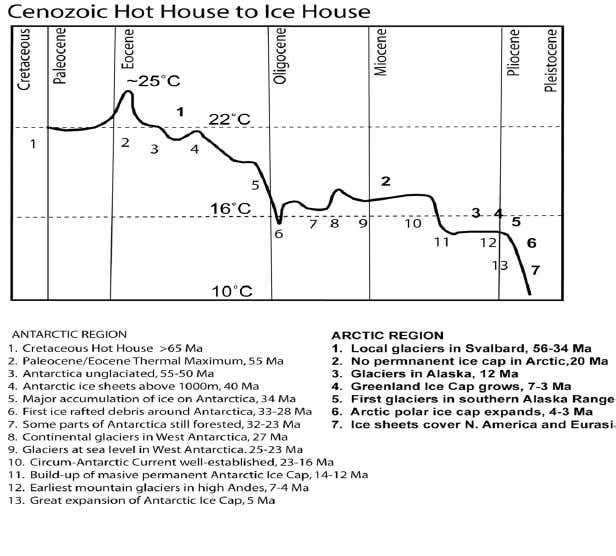
A bigger disconnect has to do with the fact that the total amount of energy received from the sun has been quite constant, rising very gradually, over the Earth’s history. However, the temperature record shows great variability, from an average of 25°C in the early Eocene (time of early mammals and birds, after the dinosaurs) down to 10°C in recent times. A broad statement of Vinos’ explanation is that the earth captures solar energy around the equator, from which it is transported by a system called meridional transport up to the poles, from which it escapes out into space. The heat transport system of Hadley, Ferrell and Polar cells of air circulation has long been well known. Vinos’ contribution is the observation that the frigid polar air cannot contain enough greenhouse gases, chiefly water vapor, to hold heat. Vast amounts of heat transferred from the tropics escape into space. Thus, ironically, when the poles are warmer, less heat can escape.
Ignoring the voices of scientists such as Fred Singer, the IPCC global warming models have long downplayed Milankovitch cycles, which are central to Vinos’ arguments throughout the book. The chain of causality linking these three cycles with observed climate phenomena is complex, and there are many other factors at work, among them levels of solar activity.
Chapter 3. Introduces the Dansgaard-Oeschger cycle. Analysis of plant remains in peat bog cores showed frequent, dramatic warmings of up to nine degrees centigrade over a few decades, followed by a slow return to a cooler state. The D-O events recur periodically. Their presence refuted the notion that climate change is a slow and steady process. Vinos presents several theories as to why D-O events appear. Whatever the cause, it is not carbon dioxide – a blow to the theory of anthropogenic carbon dioxide as a driver of global warming.
In Chapter 4. - Holocene Climatic Variability – we encounter the fact that the current warm period started abruptly, with temperatures rising almost six degrees Celsius between 11,000 and 9,000 years ago. After that they gradually fell back three degrees before the Modern Global Warming period, which began in the 18th century, brought it back up by one. Once again, significant changes in temperature occurred long before greenhouse gases rose with the Industrial Revolution. The Holocene has been interrupted by several abrupt climatic events, the most significant called Bray and Bond events, on cycles of roughly 2500 and 1000 years.
Paleoclimate students divide the past 11,500 years into two major periods, the Climate Optimum and the Neoglacial. These are further subdivided, three and two. The five periods, separated by Bray events, are characterized by different types of climates:
Pre-Boreal, 11,500– 10,500 years before present (yr BP). - Cool and sub-arctic
Boreal, 10,500– 7,800 yr BP. - Warm and dry
Atlantic, 7,800– 5,700 yr BP. – Warmest and wet Among other things, the Sahara Desert was a savannah with extensive human habitation.
Sub-Boreal, 5,700– 2,600 yr BP - Warm and dry
Sub-Atlantic, 2,600– 0 yr BP - Cool and wet. Where we are today.
Chapter 5. describes The 2500-Year Bray Cycle in more depth, going into supporting evidence in biology (plant and animal life), glacier activity, atmospheric changes, oceanic changes, hydrological changes, temperature changes and solar variability. Though there are problems reconciling all of the evidence into a single consistent history, and there is conflicting evidence to support a 2300-year Hallstatt cycle, the general trend is fairly clear. There is a relationship between solar activity, including the amount and especially the angle at which sunlight is received on account of precession and obliquity (viz, more at higher latitudes), and climate.
Chapter 6. The Effect of Abrupt Climate Change describes in detail the five rather abrupt, but periodic climate changes dividing the five periods listed above, from Pre-Boreal to Sub-Atlantic, with a special section on the Little Ice Age of 500 years ago. It concludes with a section on the climatic effects of solar grand minima - periods of time in which the sun's activity is reduced to its lowest level and there are very few sunspots – that demarcate the boundaries between these periods. Roughly corresponding with the Bray cycle, they result in significantly cooler winters and somewhat cooler summers.
Vinos writes “This climate cycle correlates in period and phase with a c. 2500-yr cycle in the production of cosmogenic isotopes, that corresponds with clusters of solar grand minima at times of abrupt cooling and climate deterioration. The abrupt cooling events usually coincide with times of human societal stress. The relationship between solar activity and cosmogenic isotope production during the past centuries confirms the c. 2500-yr solar cycle as the origin of the climate cycle.” In plainer terms, more cosmic rays produce a greater abundance of rare isotopes, among them beryllium 10, carbon 14 and chlorine 36, which serve as markers for the Bray cycle.
Chapter 7. The Elusive 1500-Year Holocene Cycle describes another cycle, similar in length to the 1500 or so years of the Dansgaard-Oeschger cycle. This cycle gave its name to the 2006 book by Fred Singer, cited below, “Unstoppable Global Warming – Every 1500 Years.” The chapter discusses evidence for such a cycle in the oceans and the atmosphere. Singer was not wrong; he was simply working with incomplete data. Though the data that Vinos presents in his book is far more complete, he goes out of his way to point out the places where his data is missing and inconsistent. Perhaps the strongest message in the book is that anybody who pretends to understand exactly how climate works is mistaken. As we continue to refine our knowledge, it becomes increasingly clear that the earth is not facing an immediate catastrophe, but that is not to say that scientists will not make surprising discoveries in the future.
Chapter 8. Centennial To Millennial Solar Cycles describes several other solar periodicities, with lengths of 1000, 210, 88, 100, and 50 years. As always, as these cycles overlap, they can reinforce or nullify one another. The major takeaway point from this chapter is that it is complex and good minds are working on it. Once again, there are no simple solutions, and anybody claiming to have one should be avoided.
Chapter 9. Greenhouse Gases And Climate Change describes the awkward fit between what is known about paleoclimate and the theory that greenhouse gases are primarily responsible for global warming. Vinos writes “In the 30 years since the IPCC was created [in 1988] a strong scientific consensus has developed about the CO2 hypothesis. This is despite a disappointing lack of advance in quantifying the effect of CO2 changes on global temperature. There is clear evidence for the observed warming, clear evidence for the human-caused increase in CO2, and abundant evidence of the CO2 effects on the biosphere. Most climatic changes detected can be clearly tied, at least in part, to the warming observed, although internal variability is often underestimated as a factor for climate change. What is crucially missing is clear indisputable evidence that the warming observed is the result of the measured increase in CO2, which the IPCC believes to be unequivocal.”
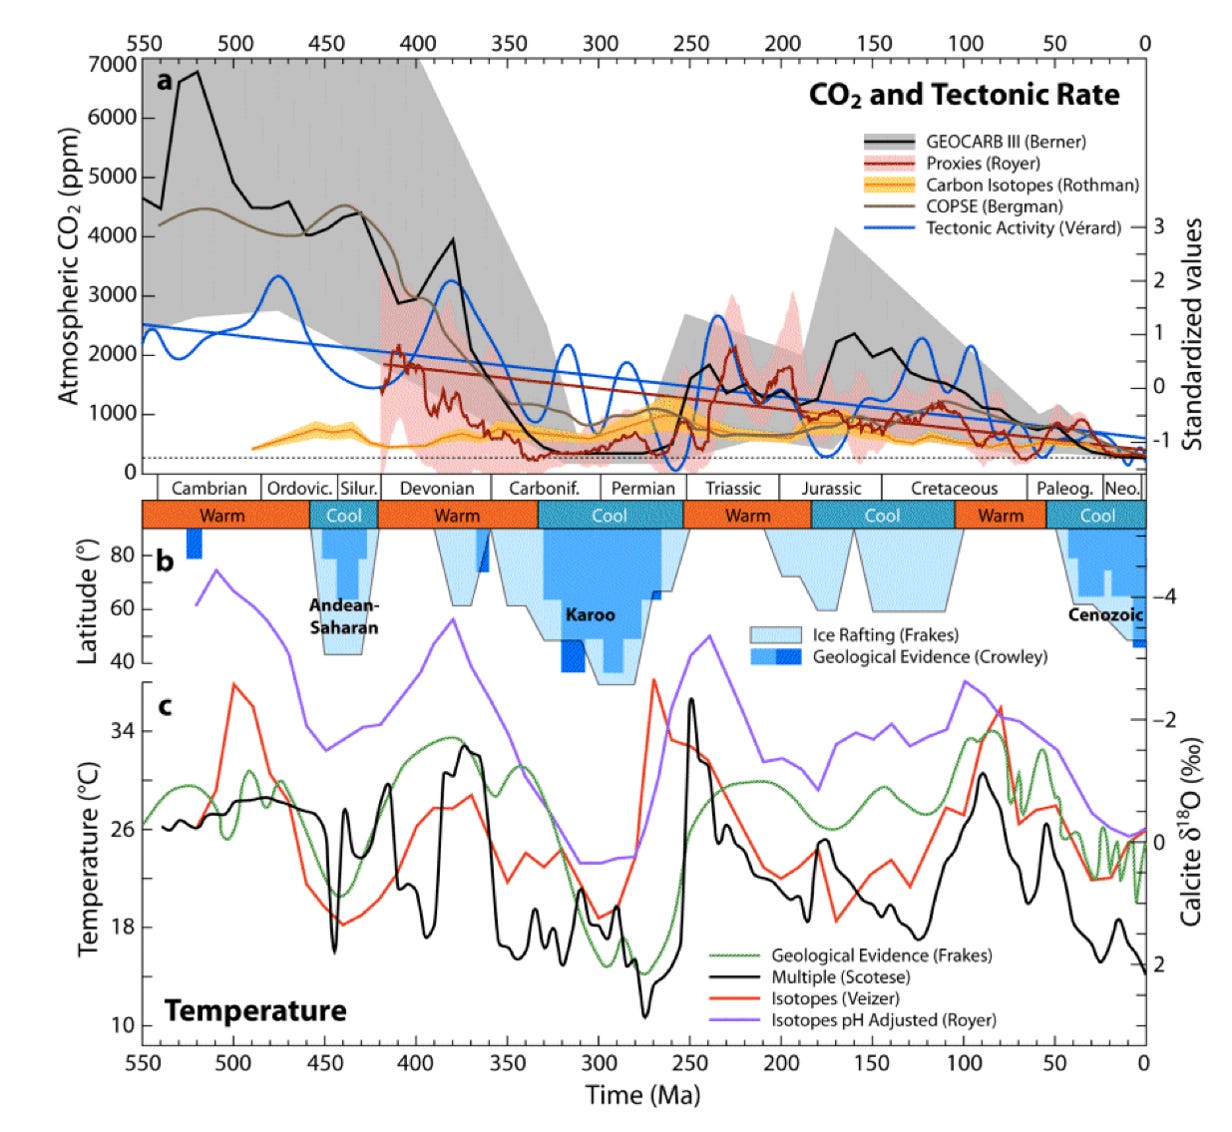
The most obvious refutation is that while the amount of carbon dioxide in the atmosphere dropped from perhaps 5,000 to 225 parts per million in the 550 million years of multicellular life, temperature has not changed much at all. The line graphs shown in Figure 2 present measurements of multiple proxies for CO2 and temperature, an indication of the imprecision of the undertaking.
Other books cited below do a better job of describing the processes that remove CO2 from the atmosphere. One is the weathering of rock. Another obvious one is that carbon is sequestered as living organisms die and are buried. Carbon is locked up in fossil fuels, the ones we are now burning. Per Vinos’ conclusion below, the absolute worst-case scenario would be a temperature gain of under five degrees Celsius, still well within the range of paleoclimate temperatures. Also see this 2017 video.
Chapter 10. Meridional Transport, A Solar-Modulated Fundamental Climate Property, describes the balance between the energy received by the earth and the energy reflected and radiated back into space. An imbalance over any substantial period results in global heating or cooling.
The surface of the earth’s outer atmosphere perpendicular to incoming sunlight receives 1361 watts/m2. The amount decreases with the angle of incidence. Albedo immediately reflects a fair percentage back out into space from clouds and the earth’s surface. What is not reflected heats things up – earth, water and atmosphere.
Hot air rises and cool air sinks. In what are called Hadley cells, air rises over the equator, heads towards the poles, and sinks at about 30 degrees latitude. In Ferrell Cells, between 30 and 60 degrees from the poles, it travels towards the poles along the surface and returns at altitude. Then, at about 60 degrees, it rises again and heads towards the pole in a polar cell. Circulation within the cells means that the direction of surface winds is opposite that of winds at altitude.
Due to the rotation of the earth, the winds are oblique rather than directly north south. The combination of north-south circulation in cells and the earth’s spin results in easterly trade winds in the tropics and prevailing westerlies in the mid-latitudes. And, pertinent to this discussion, the continual movement of warm air from the tropics to the poles. Among the related phenomena are the El Niño / La Niña effects,
Chapter 11. Meridional Transport And Solar Variability Role In Climate Change
“Between 1995 and 2005 a big shift took place in climate. The changes that took place became evident around the year 2000 and were of a global scale.” The upshot was that the global warming that had been used to stir up so much worldwide concern slowed down dramatically. The reasons, addressed in previous chapters, were predictable.
Vinos concludes the chapter with this forecast “The planet has been in the Late Cenozoic Ice Age for the past 34,000 years because it is hemorrhaging heat at the winter pole from two gigantic cooling radiators. In the early Cenozoic, heat loss at the winter pole was limited by an intense cloud-, fog-, and water vapor-greenhouse emissions during the polar night. For unknown reasons the climate started a transition from the late Triassic– early Cenozoic [200 million years ago] warm mode to the late Cenozoic cool mode, in what appears to be 150-million-year cycle [see Figure 2 above]. The water vapor reduction associated with the cooling is what drove the increasing heat loss at the winter pole. With the cooling, the latitudinal thermal gradient increased, and the meridional transport responded by transporting more heat to the winter pole, intensifying planetary heat loss. Through this positive-feedback the planet slowly cooled from the surface to the bottom of the ocean, driving a reduction in CO2 levels. If it is indeed a 140-million-year cycle, an inverse process should take the planet out of the ice age over the next 50 million years.”
In a related observation volcanic activity changes the atmosphere and has a direct influence on the climate. Vinos observes that increase and decrease of the weight of ice is associated with volcanic activity.
Chapter 12. Modern Global Warming contends that by most measures the warming we have seen over the past century is normal. Two anomalies stand out. First is the unusual rise in CO2. We know the source of that. The second is that the behavior of glaciers and ice cover (cryosphere) has not followed the normal pattern. Vinos offers some hypotheses. The industrial age has put a lot of soot into the atmosphere and changed the nature of the earth’s cloud cover. He concludes “While the evidence is strong that the unusual cryosphere reduction has an anthropogenic origin, the relative contribution from changes in temperature, greenhouse gases, and light-absorbing particles cannot be properly assessed.”
Vinos writes that “Physics shows that adding carbon dioxide leads to warming under laboratory conditions. It is generally assumed that a doubling of CO2 should produce a direct forcing of 3.7 watts per square meter (IPCC– Third Assessment Report, Ramaswamy et al. 2001), that translates to a warming of 1.0 to 1.2 degrees Celsius (by models taking into account latitude and season). But that is a maximum value, valid only if total energy outflow is the same as radiative outflow.” “For some of the feedbacks, like cloud cover we don't even know the sign of their contribution. And they are huge, a 1% change in albedo (reflection of energy back into space) has a radiative effect of 3.4 watts per square meter, almost equivalent to a full doubling of CO2. So, we cannot measure how much the Earth has warmed in response to the increase in CO2 for the past 70 years, and how much for other causes.”
“What can be seen in the warming rate record is that cooling periods have become less intense, from –0.4 degrees Celsius per decade in the late 19th century, to –0.2 degrees Celsius per decade in the mid-20th century, to zero in the 21st century pause. This decrease in cooling rate over time is a feature of modern global warming. The world is warming because it cools less during cooling periods, not because it warms more during warming periods. The reasons for this are unclear, and not discussed often in the scientific literature. There is a coincidental reduction in periods of very low solar activity, that also usually coincide with cooling periods, but other factors cannot be ruled out, including an effect from increased CO2 levels at reducing the severity of cooling periods, or a reduction in volcanic activity.”
“The recent scientific discussion over the existence of a global warming hiatus is easily settled, as the hiatus can be mathematically defined as a 17.5-year period between February 1998 and July 2015 when the accumulated monthly rate of warming was below zero. If the rate of global warming continues decreasing over the next decades, we may expect more such periods without warming in the future. Some researchers are already warning about this possibility.”
He concludes by driving a stake into the heart of the global warming monster, making these four points.
1. The world has continued warming as before. The warming during the 1975– 1998 (or 1975– 2009) period is not statistically significantly different from the warming during the 1910– 1940 period.
2. The temperature increase since 1950 shows no discernible acceleration and can be fitted to a linear increase. The logarithm of the CO2 increase, however, displays a very clear acceleration. A linear relation between supposed cause and effect cannot be established.
3. Sea level has continued rising as before. Its acceleration is not responding perceptibly to the increase in anthropogenic forcing.
4. [Glaciers and ice cover] shows a non-cyclical retreat in glacier extent with evidence of acceleration. The reduction of the size of ice shelves is also unusual. We cannot distinguish if the cryosphere is responding mainly to the CO2 increase, the temperature increase, or to the increase in light-absorbing particles.
“Despite CO2 levels that are almost double the Late Pleistocene average, the climatic response is subdued, still within Holocene variability, below the Holocene Climatic Optimum and below warmer interglacials. Lack of support for the CO2 hypothesis from Antarctic ice cores and from results 1-3 above has forced the proponents of the hypothesis to make numerous new unsupported assumptions. They assume that:
1. All warming since 1950 is anthropogenic in nature.
2. Past recorded temperatures must be cooler than previously thought.
3. The oceans, and volcanic eruptions, are delaying the surface warming and sea level rise.
4. More time is required to observe the warming and SLR acceleration.
All these might be true, but the simplest explanation (Occam's favorite) is that an important part of the warming is due to natural causes, and CO2 only has a weak effect on temperature. If after 70 years of extremely unusual CO2 levels, a lot more time is required to see substantive effects, then the hypothesis needs to be changed.”
Chapter 13. 21st Century Climate Change is a look into the future. We cannot make straight-line projections for CO2 emissions. Populations are falling, we are getting more energy-efficient, and we are switching away from coal. We can expect no dramatic changes in solar activity. Arctic sea ice has not disappeared, and will not, despite the shrill warnings prior to 2005. Sea levels will rise as they have been rising, maybe 34 cm by 2100. Nobody will drown.
Chapter 14. The Next Glaciation. This conclusion is an anticlimax. “Without human intervention the next glaciation should start in just 1500-4500 years. The question that we cannot answer with any degree of certainty is how high CO2 levels would have to be to prevent glacial inception. Summer energy is going to be very low for the next 20,000 years and that should require sufficiently elevated CO2 levels for that long. Alternatively technology could develop to a point when it is possible for humankind to prevent the next glaciation. Those are questions that cannot be answered, but we can make reasonable inferences from what we do know. Over the past 150 years it is calculated that we have produced 545 gigatons of carbon leading to an increase in atmospheric CO2 of 125 parts per million. Estimates from reputable sources place fossil fuel peak production in a few decades. Even if fossil carbon is more abundant, we might already have extracted one-third to half of what we will extract over the next centuries. Supply constraints should limit our emissions even in the unlikely case that we don't limit them ourselves. If these estimates are correct, peak atmospheric CO2 levels should not go much above 550 parts per million (ppm). A rapid decline in CO2 should follow as oceans and the biosphere absorb most of it, but according to current models about 320 ppm should remain for a very long time. If this assumption is correct, the question is if 320 ppm of CO2 could stop a glaciation, as the IPCC claims with virtual certainty. We know the Eemian [interglacial, ending 115,000 years ago] entered glaciation with 270 ppm, 50 ppm below future estimated levels. An opposite result from just 50 ppm difference would require a very high climate sensitivity to CO2. The 100 ppm increase between 1959 and 2021 has been accompanied by climatic variability within interglacial range, as Holocene Climatic Optimum conditions have not been reproduced. Achieving changes of an interglacial-glacial scale might require a much larger amount of greenhouse gases than available.”
That ends the review of a challenging book. Testimony to its value is the fact that it is in a second edition, has been widely translated, and has so many reviews prior to this one. Absolutely five stars.
See reviews also of the following, some supporting but most, like Vinos, challenging the Global Warming narrative: How to Spend $50 Billion to Make the World a Better Place, Whole Earth Discipline, Vast Machine, Global Warming Gridlock, Climate Change Reconsidered, Climate Change Reconsidered: The Report of the Nongovernmental International Panel on Climate Change, The Neglected Sun – Why the Sun Precludes Climate Catastrophe, The Fanaticism of the Apocalypse: Save the Earth, Punish Human Beings, The Ends of the World: Volcanic Apocalypses, Lethal Oceans, and Our Quest to Understand Earth's Past Mass Extinctions, Climate Diplomacy from Rio to Paris: The Effort to Contain Global Warming, Climate Wars: Policy, Politics and the Environment, Feasible Planet: A guide to more sustainable living, Merchants of Despair: Radical Environmentalists, Criminal Pseudo-Scientists, and the Fatal Cult of Antihumanism , Apocalypse Never: Why Environmental Alarmism Hurts Us All , Guide to the Climate Apocalypse: Our Journey from the Age of Prosperity to the Era of Environmental Grief.

Quite enjoyable read. Clearly a complex topic for your review. Wonder how the climate scam can remain viable but clearly the Covid crowd isn't giving up. When I understood that clouds are a key and they couldn't be properly handled, I doubted the data. Thanks for the work. I remain impressed.
Thank you for the compliment of your offer! I often find your reviews thought-provoking because they come from points of view which don't often cross my screen. However, I hesitate for a couple of reasons. First, I would not be a reliably timely reader as I grab moments when I can (I'm a caregiver to someone with dementia, who is now napping). Second, we draw different conclusions even from similar data. (For example, I used to teach a 3rd year undergraduate course in the psychology of intelligence and creativity. I find the apparent racial differences in IQ scores to be overdetermined to such an extent that conclusions of race-linked genetic superiority are not supportable). If you don't mind, given these reasons, I would prefer to comment from the sidelines. Hope that's acceptable.